After 5 years of operation, K-Monitor and TI Hungary decided to perform some updates on the redflags.eu platform. Among these are improvements on the indicators, extension of the data sources and the deployment of a BI module. In this blogpost we’ll introduce the features of that module.

When launching the redflags.eu portal, only the most important filters were implemented where we had no doubts about their usefulness. In the past period we interviewed users of the site and consulted experts, such as the Dozorro Team of TI Ukraine about further possibilities to search in the database, visualize information and browse documents. Based on the inputs received, the availability of data and the IT capacities we had, the following developments were done.
Filters
New filters have been introduced that allow filtering among contract types and procedure types, furthermore filtering on the number of bids. Previously the portal was only able to look up one bidder or contracting authority. This has been enhanced, so that users can select several companies in case they are investigating a group of economic actors. Specially on request from users coming from public authorities a filter was added that allows looking up the ID-s of procurements (previously this was done by changing the URL of a tender in the browser).
Ranking and data export
A serious shortcoming of the redflags.eu portal was that it did not allow users to rank search results or export them. Among other improvements, the possibility of ranking tenders was created based on value, date, flag count, length of bidding and decision making period. Furthermore a feature was added that allows exporting 1000 search results.
Visualisation
Simple charts help to understand the figures behind the database and search results according to the most important dimensions of tenders.
CPV codes
Users can now look up top lists of CPV codes, or look up CPV codes they are interested in, in order to find out what CPV codes are most commonly accompanying a selected CPV code, how many tenders of that type were awarded in a given period, what contracting authorities are buyers of the given service or product or to see the bid counts of tenders in that category. Results can be visualized according to the number of tenders and tender values.
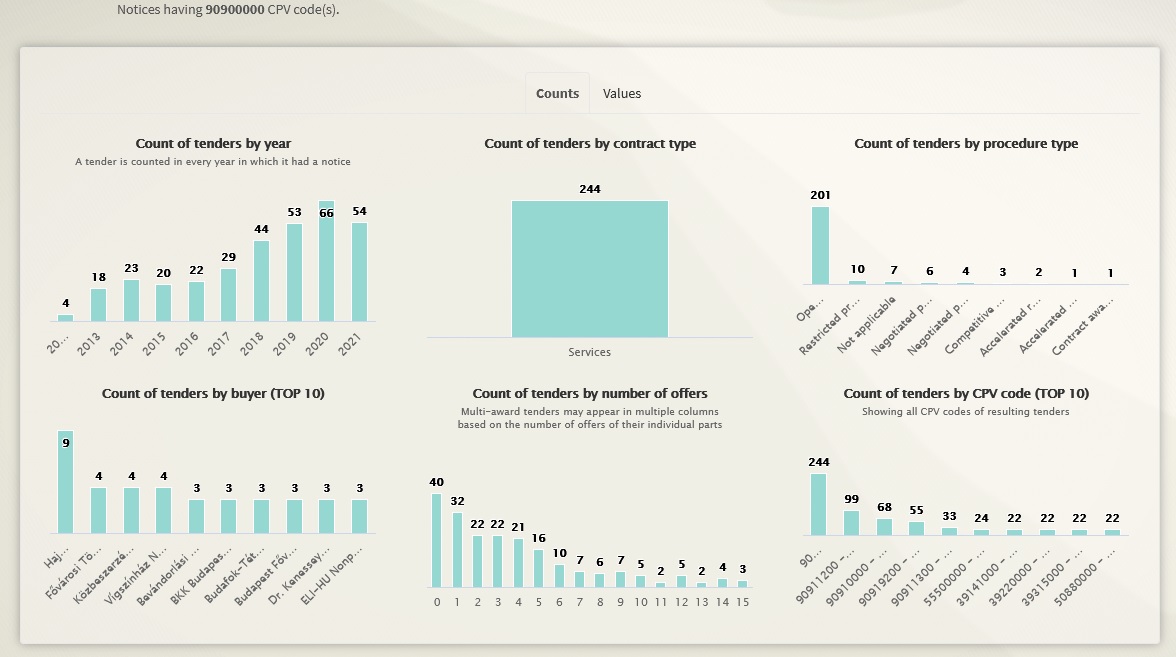
Number of tenders for cleaning services
Bid count
Let’s take another example for the visualization of tender statistics. A very commonly used indicator for poor procurement performance is single bidding. When setting the filter for bid count to 1, one can immediately observe the basic information on single bidding. Regarding the value of tenders, it is much more rare in case of works than at goods and services, healthcare institutions are among the top buyers that receive single bids (based on tender value), and the value of tenders that was awarded based on a single bid was increasing over the last 5-6 years.
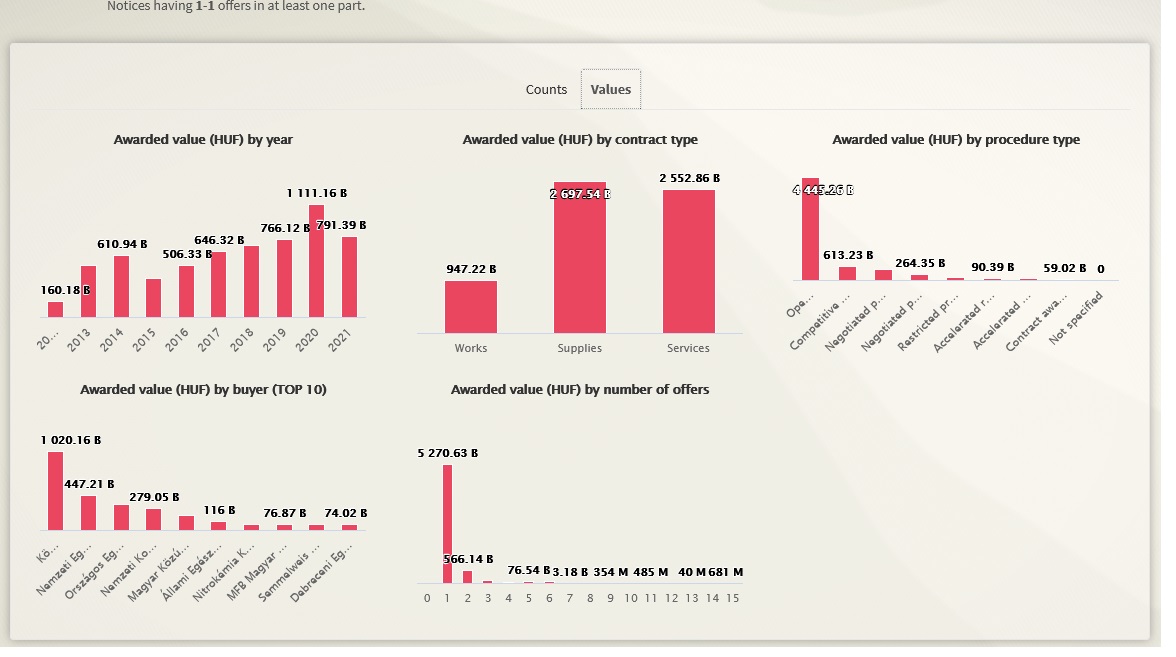
Value of tenders with a single bid (on the last graph, multi-award tenders may appear in several columns)
Buyers stats
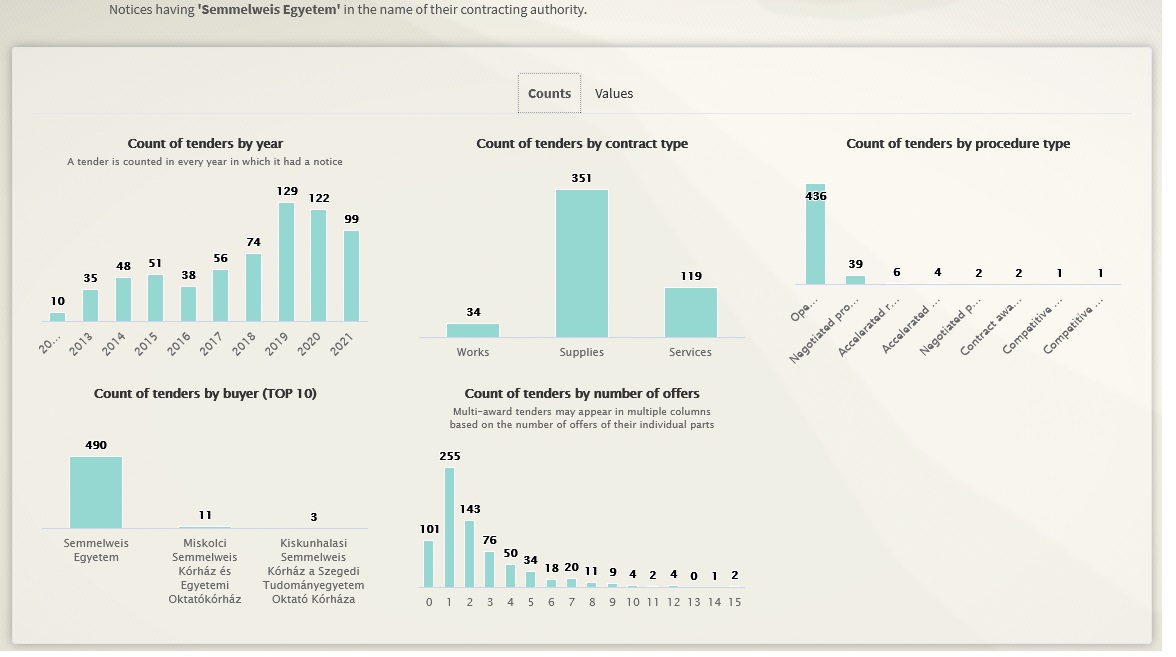
The BI module also helps to create the profile of buyers based on tender count and value. In the example below we filtered on Semmelweis University, the biggest medical university of Hungary that operates one of the main clinics of Budapest. It becomes easily visible that their tenders more often than not, have only one bidder and most frequently they procure goods.
Bidder stats
The same works of course for bidders. Besides the number of tenders won, the list of top buyers or bid count, one can also observe what other companies were partners of the filtered bidder.
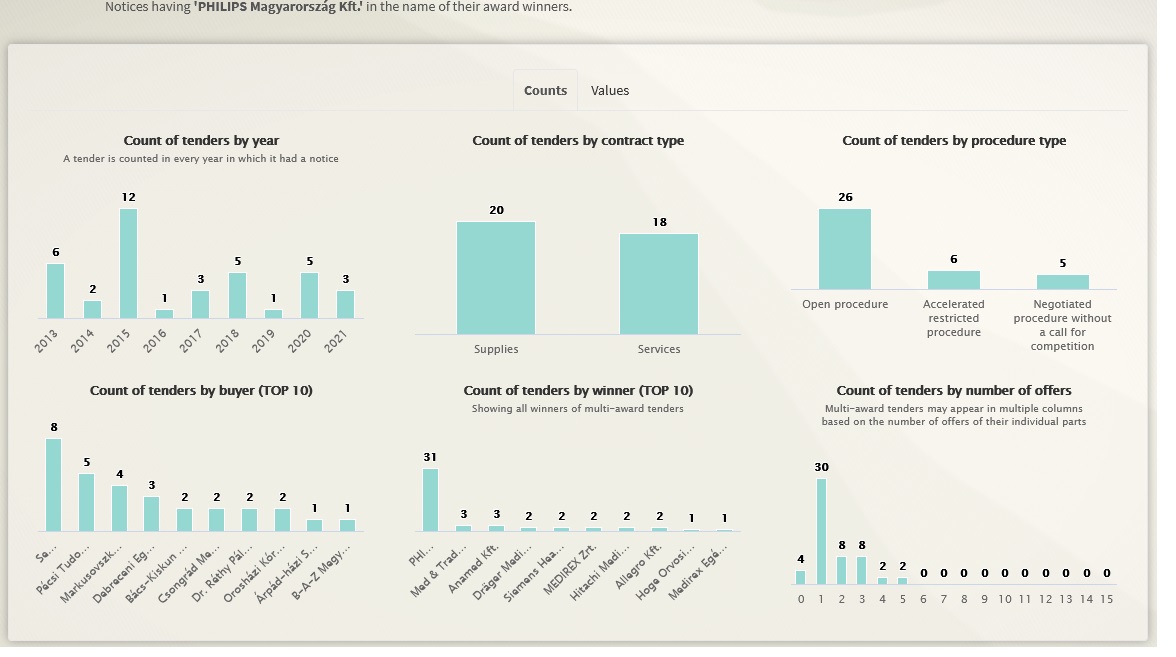
Unexpected findings
The visualisation and the ranking module also helped to detect data errors coming from the official data publication. When looking at the value of tenders of the total period covered, in 2017 an unexpectedly high value can be observed. When looking into the details it turned out that the procurement bulletin included an extreme high value for a small tender by mistake. One can see that a tender conducted by the National Archives is the reason for extremely high tender value in 2017 that also distorts the value of 3 bidder tenders, services and open procedures.
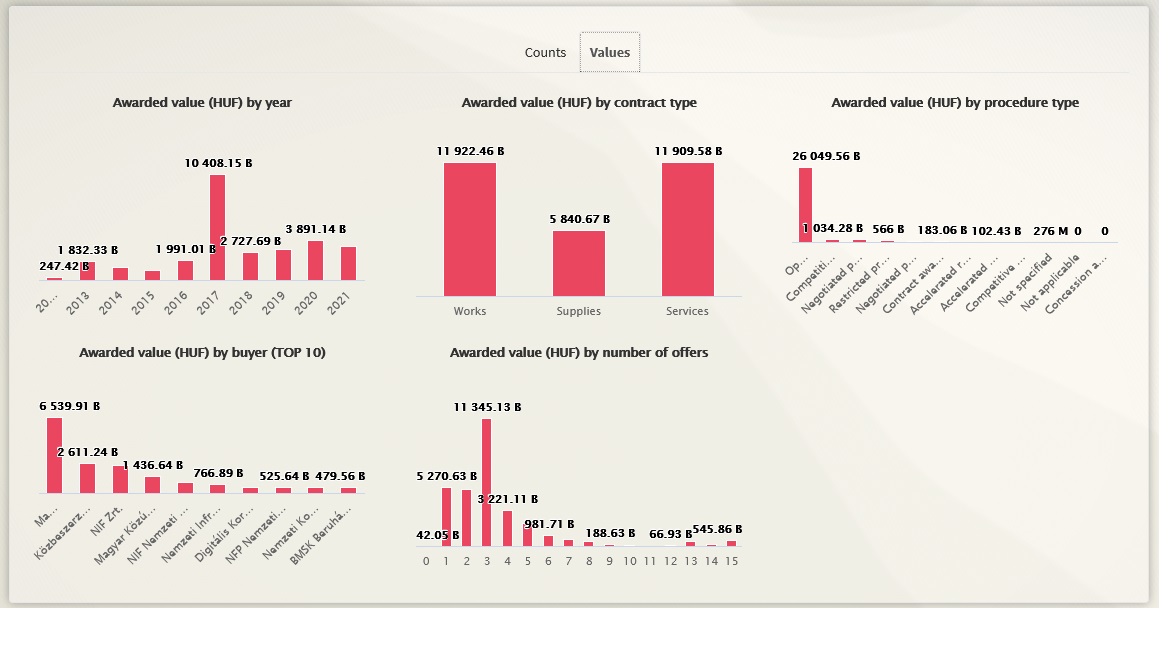
Basic facts
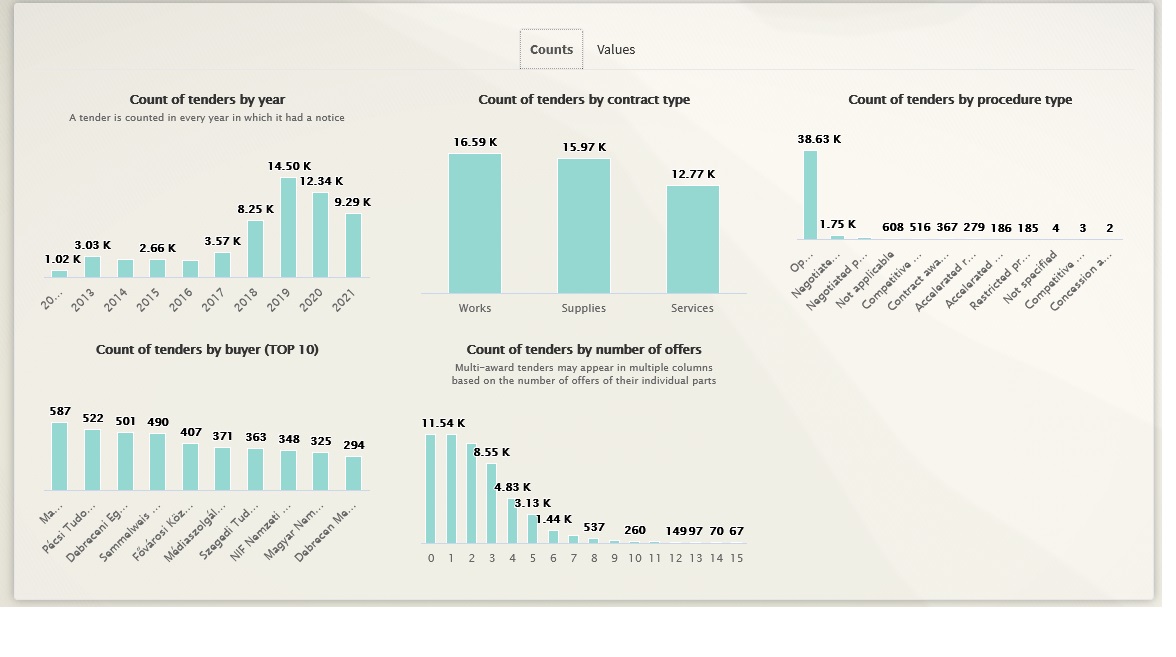
When looking at the tender count we see data data in the system is inline with official procurement statistics. An increase in tender count can be observed in 2018, the year Hungary introduced an e-procurement platform, that serves as a data source for the tenders.guru portal. Redflags.eu uses tenders.guru API as a data source for tenders below the EU threshold. Prior to that date only tenders from TED, the European Tenders Daily are included on the portal. A common issue of Hungarian procurements becomes visible on this graph as well, the extreme high amount of tenders with a single bid. A finding that is much less discussed publicly and needs further investigation is the similarly high amount of tenders without a bid.
The development of the new BI module on redflags.eu was supported by the Visegrad Fund as part of the project “"Tackling corruption in public procurement in Ukraine and V4 countries with new approaches" conducted by Transparency International Ukraine.
Címkék: english red flags
Szólj hozzá!
A bejegyzés trackback címe:
Kommentek:
A hozzászólások a vonatkozó jogszabályok értelmében felhasználói tartalomnak minősülnek, értük a szolgáltatás technikai üzemeltetője semmilyen felelősséget nem vállal, azokat nem ellenőrzi. Kifogás esetén forduljon a blog szerkesztőjéhez. Részletek a Felhasználási feltételekben és az adatvédelmi tájékoztatóban.

